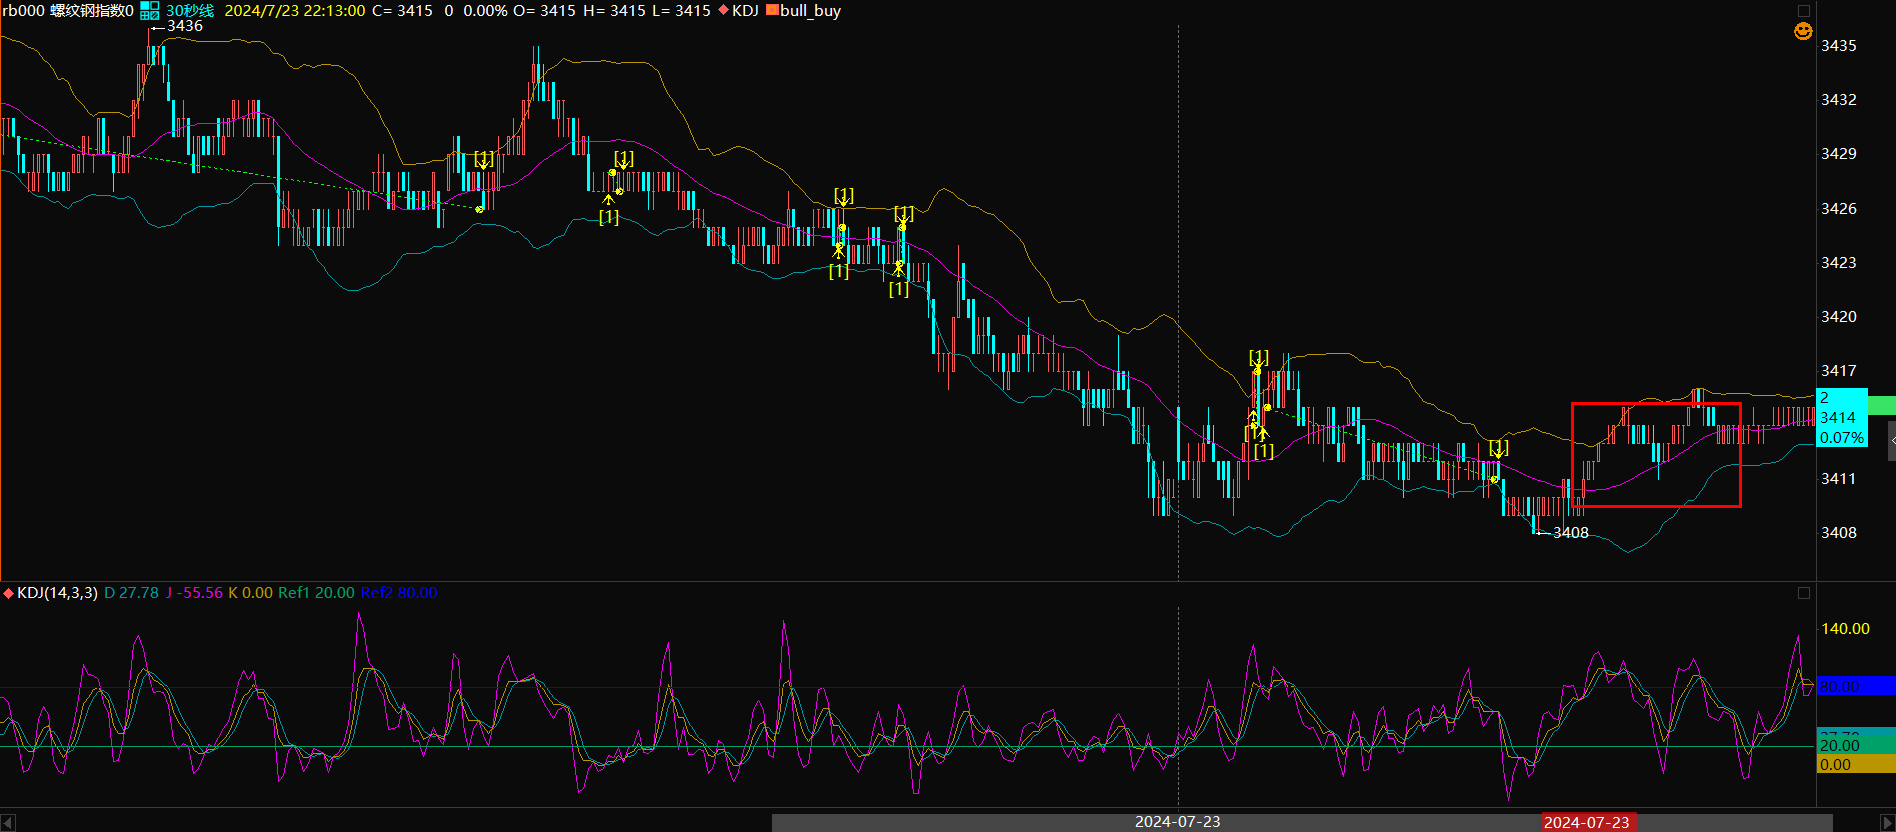
请问老师,简单的boll做多 策略,为什么在图表中这段没有信号
//------------------------------------------------------------------------
// 简称: bull_buy
// 名称: boll多
// 类别: 公式应用
// 类型: 用户应用
// 输出: Void
//------------------------------------------------------------------------
Params
Numeric Length(26); //周期
Numeric k(2); //标准差倍数
Numeric ss(1); //手数
Vars
Numeric UpLine; //上轨
Numeric DownLine; //下轨
Numeric band; //下轨
Series<Numeric> MidLine; //中间线
//Series<Numeric> diff_mid; //中轨差
Events
OnBar(ArrayRef<Integer> indexs)
{
MidLine = AverageFC(Close,Length);
Band = StandardDev(Close,Length,2);
UpLine = MidLine + k * Band;
DownLine = MidLine - k * Band;
PlotNumeric(UpLine,UpLine);
PlotNumeric(DownLine,DownLine);
PlotNumeric(MidLine,MidLine);
if (MarketPosition <>1 && MidLine-MidLine[1]>0 && MidLine[1]-MidLine[2]<0)
{
buy(ss,close);
}
If(MarketPosition == 1 && MidLine-MidLine[1]<0 && MidLine[1]-MidLine[2]>0)
{
sell(ss,close);
}
}